Andrew McCutchen had a very solid sophomore year in 2010, but he experienced an extended slump around midseason that dragged his overall numbers down a bit. Anecdotally, at least to my eyes, he seemed to be a little pull-happy during this period. He seemed determined to yank everything into left field, including pitches on the outer half of the plate. This resulted in numerous ground balls to shortstop and third base. Unfortunately, I could not figure out a way to quantify this.
First, let’s take a look at McCutchen’s slump. Here are his monthly splits. You can see that he struggled greatly in July, despite a season low strikeout rate.
| Month | BB% | K% | ISO | wOBA |
| Mar/Apr | 6.70% | 17.50% | 0.144 | 0.366 |
| May | 12.40% | 17.30% | 0.163 | 0.390 |
| Jun | 13.60% | 20.20% | 0.160 | 0.363 |
| Jul | 7.90% | 13.40% | 0.104 | 0.290 |
| Aug | 9.20% | 15.10% | 0.189 | 0.335 |
| Sept/Oct | 13.20% | 10.20% | 0.194 | 0.404 |
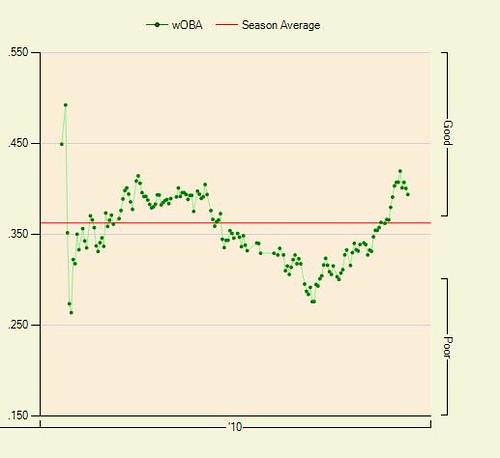
Here is a visual look at McCutchen’s Weighted On-Base Average (wOBA) over the course of the season.
I recently succeeded in setting up a Pitch f/x database, so I decided to revisit this topic. Based on the information available at FanGraphs, we can determine the rates in which McCutchen hit to left field, center field and right field in 2010.
| Left Field | 40.7% |
| Center Field | 37.4% |
| Right Field | 21.9% |
As you can see, McCutchen was a pull hitter in 2010. FanGraphs also gives us the batted ball distribution for each direction.
| LD% | GB% | FB% | |
| Left Field | 23.4% | 57.4% | 19.3% |
| Center Field | 15.0% | 42.2% | 42.8% |
| Right Field | 16.8% | 19.6% | 63.6% |
We now know that the large majority of balls McCutchen pulled to left field were hit on the ground. If I were to venture a guess, I would say that this was very likely due to his attempts to pull outside pitches. Let’s try to find the answer via Pitch f/x.
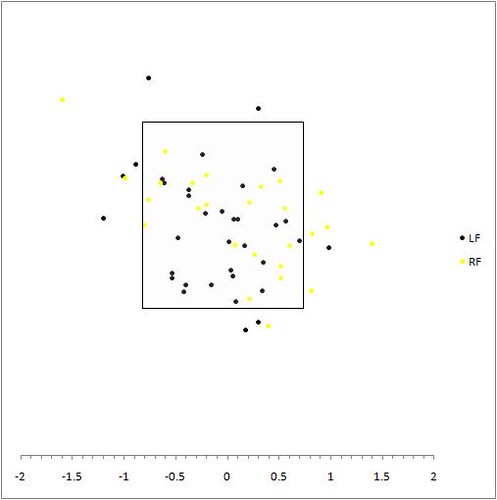
Here are the pitch locations for every ball that McCutchen put into play in 2010. I added an approximate strike zone. Pitches in black were pulled to left while pitches in gold were hit the opposite way to right field. For simplicity, I did not include a center field category. This is far from ideal, but it would have been nearly impossible for me to look at more than those two categories.
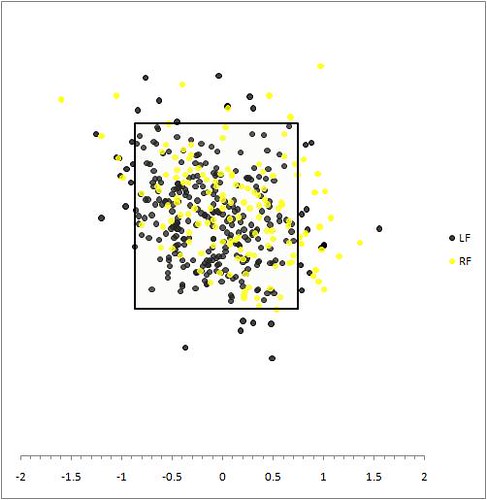
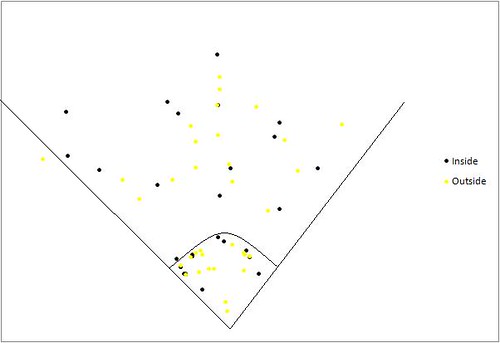
This does not seem to tell us much. McCutchen basically hit any pitch to any part of the field. So I tried a different route. Here is McCutchen’s 2010 spray chart. Hits that occurred on pitches on the inner half of the plate are in black, and hits that came on pitches on the outer half are in gold. Please note that these marks indicate the location in which the ball was first touched by a fielder, not where it actually landed. That is why there is a noticeable gap in the shallow parts of the outfield.
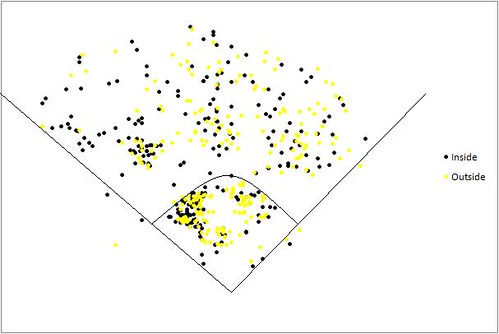
Again, this does not seem to tell us much. I isolated the pitches that were pulled from the outer half of the plate, to see if that would tell us something more.
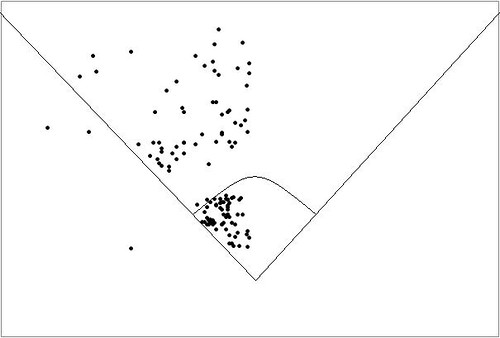
The majority of these hits appear to be ground balls. They either stayed in the infield or were fielded in shallow left field. That is to be expected.
Finally, I decided to look at balls in play during the month of July. Here are the pitch locations, separated by the direction of the hit.
Here is a spray chart, separated by pitch location.
Once again, I don’t notice any clear patterns in these charts. So I guess I will simply end here. I cannot provide a useful conclusion, just some interesting charts and images for you to enjoy.